Blog/Introducing Database Monitoring for Status Harbor
Introducing Database Monitoring for Status Harbor
Status Harbor now monitors PostgreSQL and MySQL/MariaDB via the Lighthouse agent - no new agent, no inbound ports, no database exposed to the internet. Live health with incidents, a graded config audit with copy-paste remediation SQL, on-demand slow queries and a config-fitness verdict.
July 12, 2026
Introducing Database Monitoring for Status Harbor
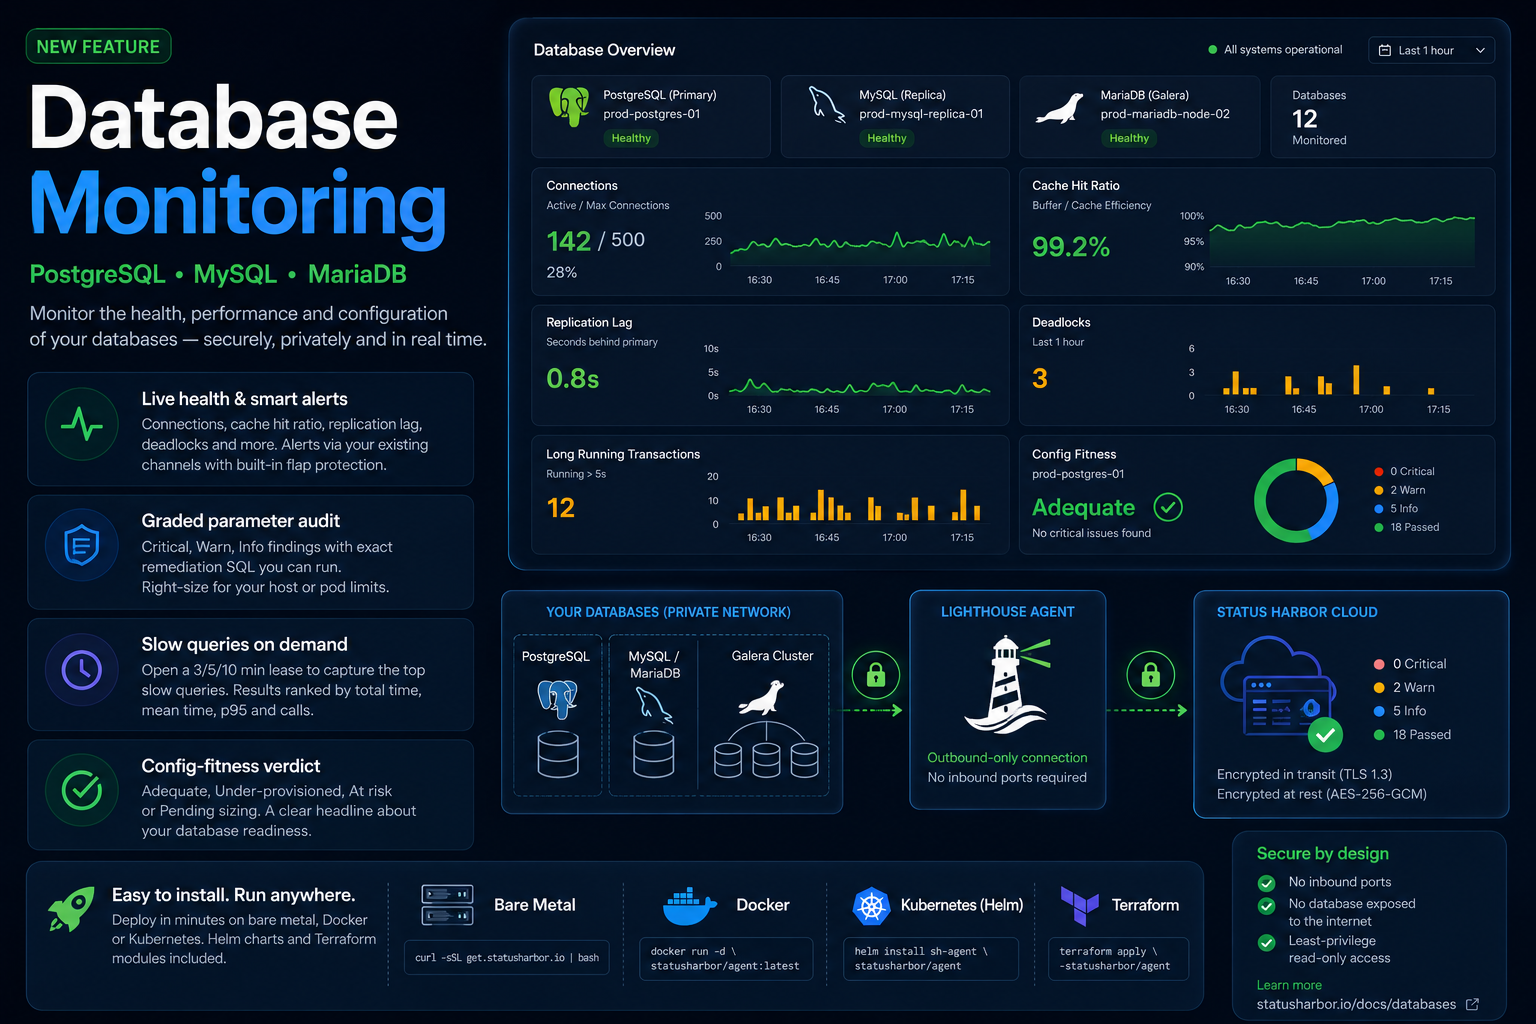
Status Harbor now monitors PostgreSQL and MySQL/MariaDB through the Lighthouse agent you already run - no new agent, no inbound ports, no database exposed to the internet.
Your database, not on the internet
The Lighthouse agent lives inside your network and dials outward to Status Harbor. Nothing dials in. You enter a DSN in the console; it is stored encrypted at rest (AES-256-GCM), never returned to the browser and delivered to the agent sealed. The database never needs an inbound port, a firewall hole or an IP allowlist.
The agent connects with a read-only role you create. The console shows the exact grant when you add a database:
-- Postgres 9.6+
CREATE ROLE sh_agent LOGIN PASSWORD '...';
GRANT pg_monitor TO sh_agent;

-- MySQL / MariaDB
CREATE USER 'sh_agent'@'%' IDENTIFIED BY '...';
GRANT PROCESS, REPLICATION CLIENT ON *.* TO 'sh_agent'@'%';
GRANT SELECT ON performance_schema.* TO 'sh_agent'@'%';
Status Harbor never asks for superuser and never writes to your database.
Supported engines and topologies: PostgreSQL (9.6 and up), MySQL, MariaDB and the common forks - Percona Server and Galera Cluster. Topologies covered: standalone, Postgres streaming replication (sync or async), MySQL/MariaDB async primary-replica and Galera multi-writer. For clustered setups, register one connection string per node; primary and replica roles are auto-detected, no orchestrator integration required.
One honest scope note: managed cloud endpoints reachable only from the public internet are not covered in this release. The Lighthouse agent has to reach the database from inside the network.
What you get
There are four things database monitoring ships with.
1. Live health, through the alerting you already have
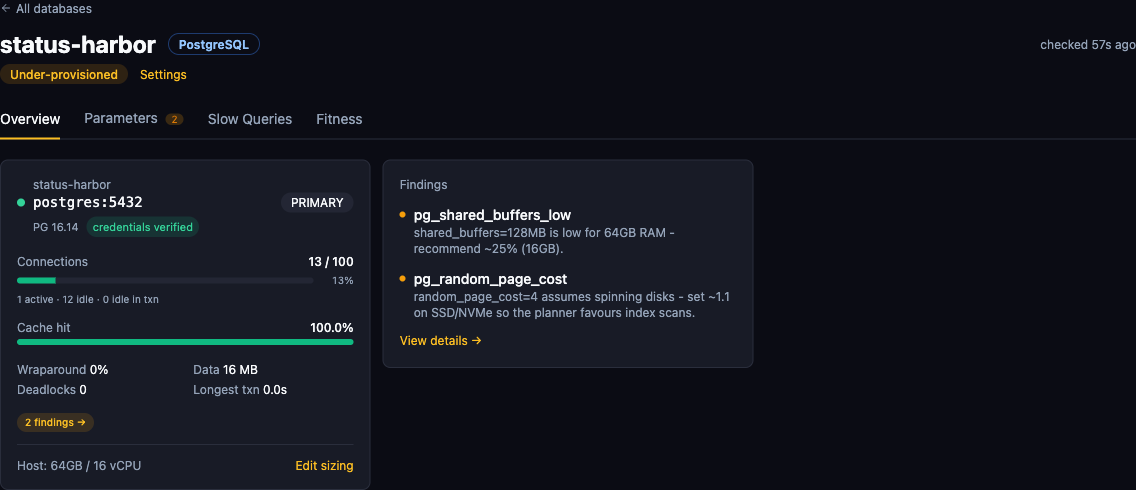
The agent tracks connection usage against max_connections, cache hit ratio (Postgres) and InnoDB buffer-pool hit ratio (MySQL), deadlocks, long-running transactions and transaction-wraparound headroom on Postgres. For clusters it watches replication lag, detects a zero-primary state (outage) and a two-primary state (split-brain) and tracks failover readiness.
When a metric breaches its threshold it raises an incident through the same pipeline and channels your uptime monitors already use. Nothing new to wire up. Warnings get flap protection before firing; criticals fire immediately. Defaults are opinionated and based on what causes real outages.
2. Graded parameter audit with exact remediation SQL
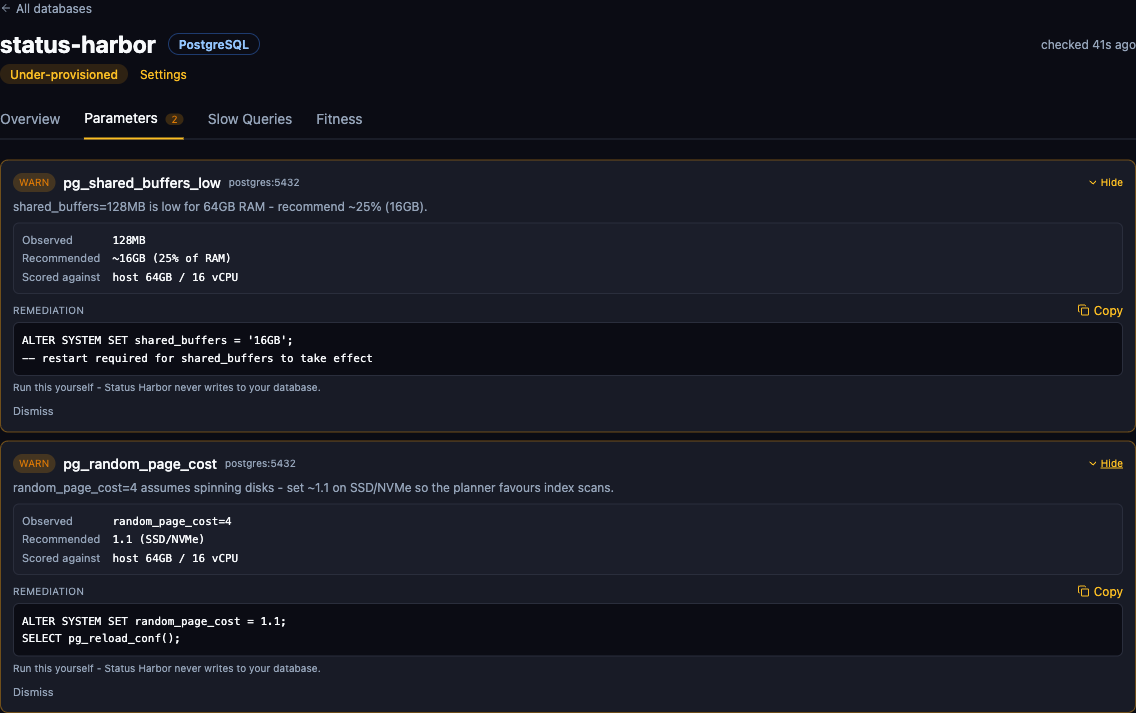
When the agent first connects it reads the database configuration and scores it. Findings come back in three tiers.
Critical - durability or crash risk. Example: fsync = off on Postgres or innodb_flush_log_at_trx_commit set to 0 or 2 on MySQL. The remediation is copy-paste SQL you run yourself:
-- MySQL: restore durable flush
SET GLOBAL innodb_flush_log_at_trx_commit = 1;
-- also set innodb_flush_log_at_trx_commit = 1 in my.cnf so it survives a restart
Warn - capacity or performance. Typical findings: shared_buffers too small for the available RAM, innodb_buffer_pool_size undersized, random_page_cost still at 4.0 on an SSD host.
Info - advisory. Example: MySQL query cache enabled (deprecated and a lock-contention source in high-write workloads).
Every finding records the observed value, the expected value and the sizing it scored against - host RAM and cores or on Kubernetes the pod's cgroup limit. That last part matters: a database tuned for the full host RAM will flag correctly as under-provisioned when it is running inside a 4 GB pod and approaching OOM.
Remediation is always copy-paste SQL you run on your own schedule. The agent reads your database; it never touches configuration.
3. Slow queries on demand - a short lease, not always-on
Slow-query collection works through a timed lease. You open a window of 3, 5 or 10 minutes from the console; while it is active the agent samples the top normalized queries every 30 seconds then stops. Results are ranked by total time and mean time, with call count, p95 and row count.
This requires pg_stat_statements in shared_preload_libraries on Postgres or performance_schema enabled on MySQL. If either prerequisite is missing the console shows the exact setup step before you open a lease.
4. Config-fitness verdict
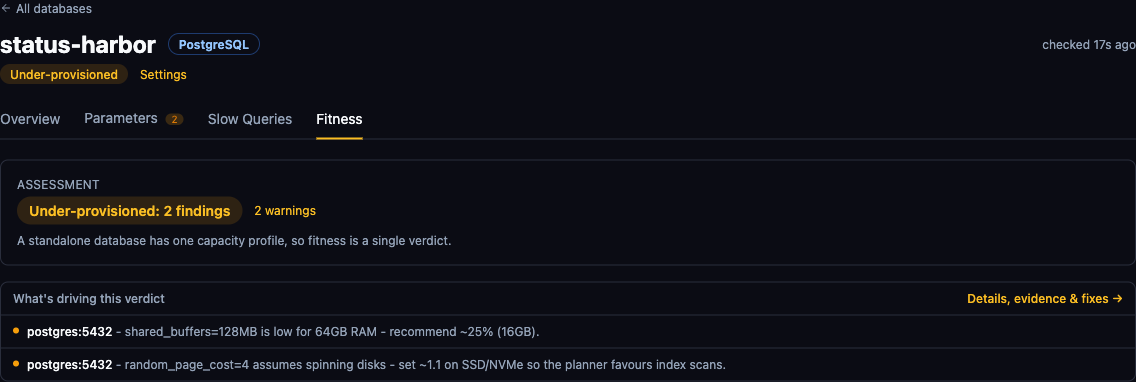
At the top of every database detail page is a single headline: is this configuration adequate for the load and data it carries? The verdict is one of four values - Adequate, Under-provisioned: N findings, At risk: N findings or Pending sizing (until you enter the host or pod specs). It is a text headline, not a score or a grade.
How to start
If you already run a Lighthouse agent, open Databases -> New Database in the console, name it, pick the engine, select the lighthouse and paste one connection string per node. Run the least-privilege grant the dialog shows you. The first health snapshot and configuration audit run automatically after that.
If you do not run Lighthouse yet, the docs at statusharbor.io/docs/databases walk through install for bare metal, VMs and Kubernetes - single binary or container, no inbound ports.
Database monitoring is a plan feature. Check statusharbor.io/pricing to confirm it is available on your plan.