Blog/Introducing Metrics: Real-Time Host Observability for Your Lighthouse Agents
Introducing Metrics: Real-Time Host Observability for Your Lighthouse Agents
Metrics turns every Lighthouse agent into a host observability probe - real-time CPU, memory, load, disk and network charts, threshold alert rules with previews, per-host snoozes and a firing-alerts timeline, all in the same dashboard as your uptime checks.
June 19, 2026
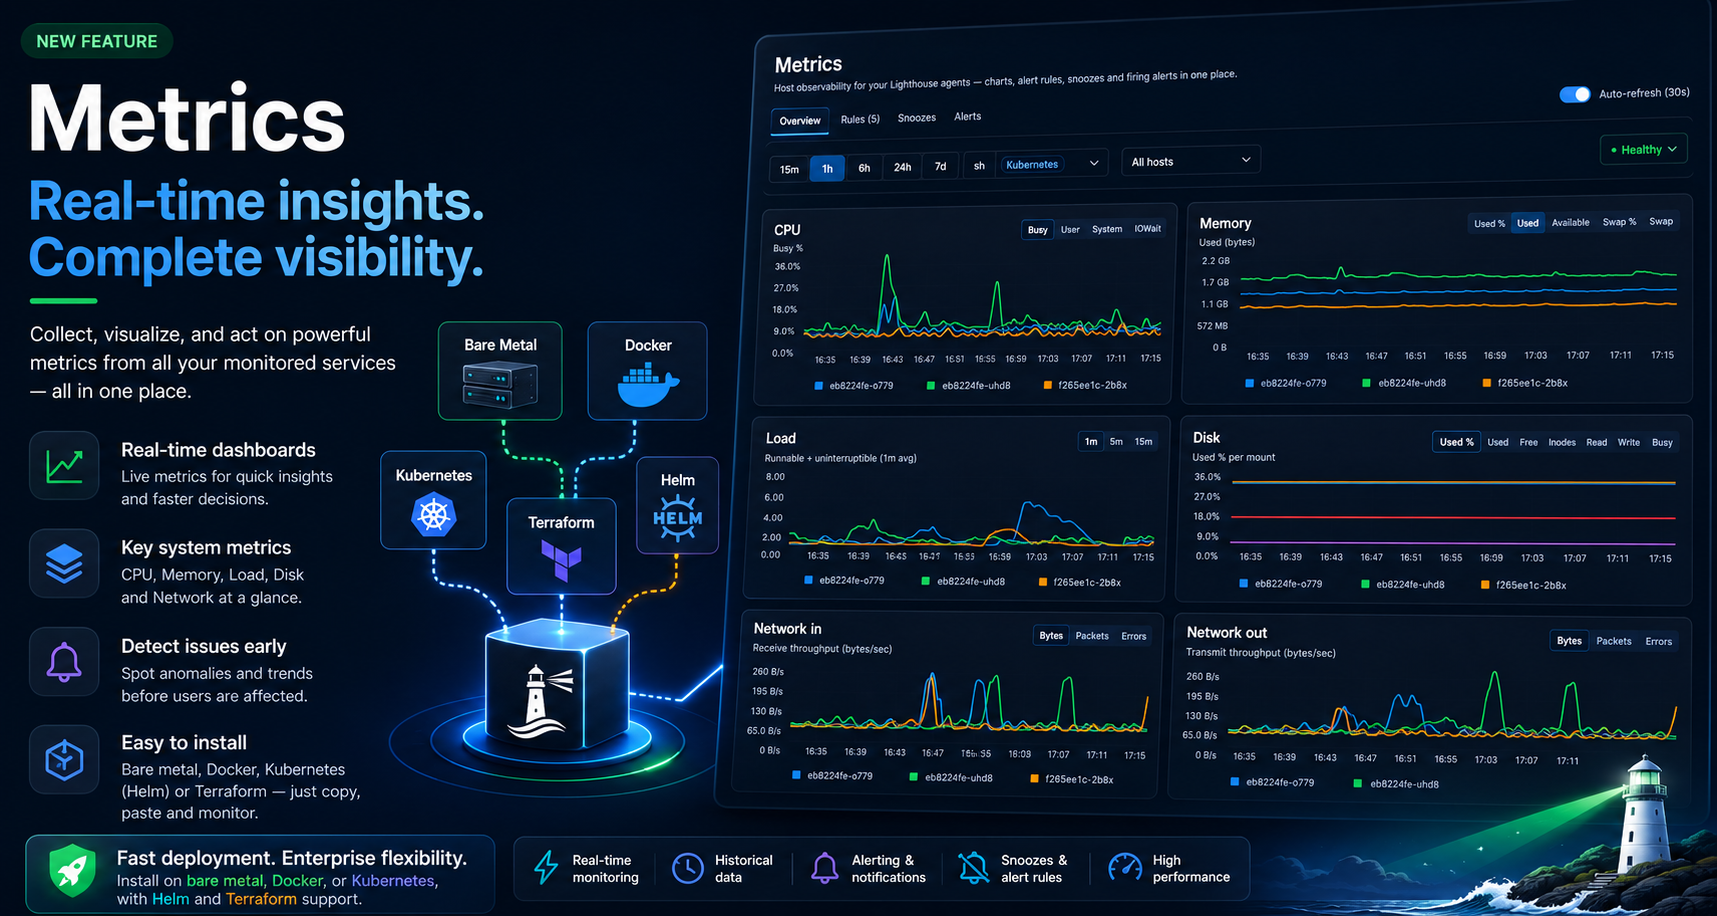
Up to now, a Lighthouse agent did one job: probe your private services and report whether they were responding. That answered "is it up" - but not "why is it slow", "is the box running hot" or "did disk just fill up at 3am".
Metrics is the answer to the second half of that question. Every Lighthouse agent you've already installed now doubles as a host observability probe. Real-time charts for CPU, memory, load, disk and network. Threshold-based alert rules you build in the UI. Per-host snoozes for the noisy ones. A firing-alerts timeline that opens incidents automatically and closes them when the metric clears.
No new agent to install. No second observability stack to run alongside Status Harbor. Same dashboard, same alert channels, same uptime math you already use.
What you get out of the box
The Metrics workspace lives one click off your Lighthouses page. Four tabs cover the whole lifecycle:
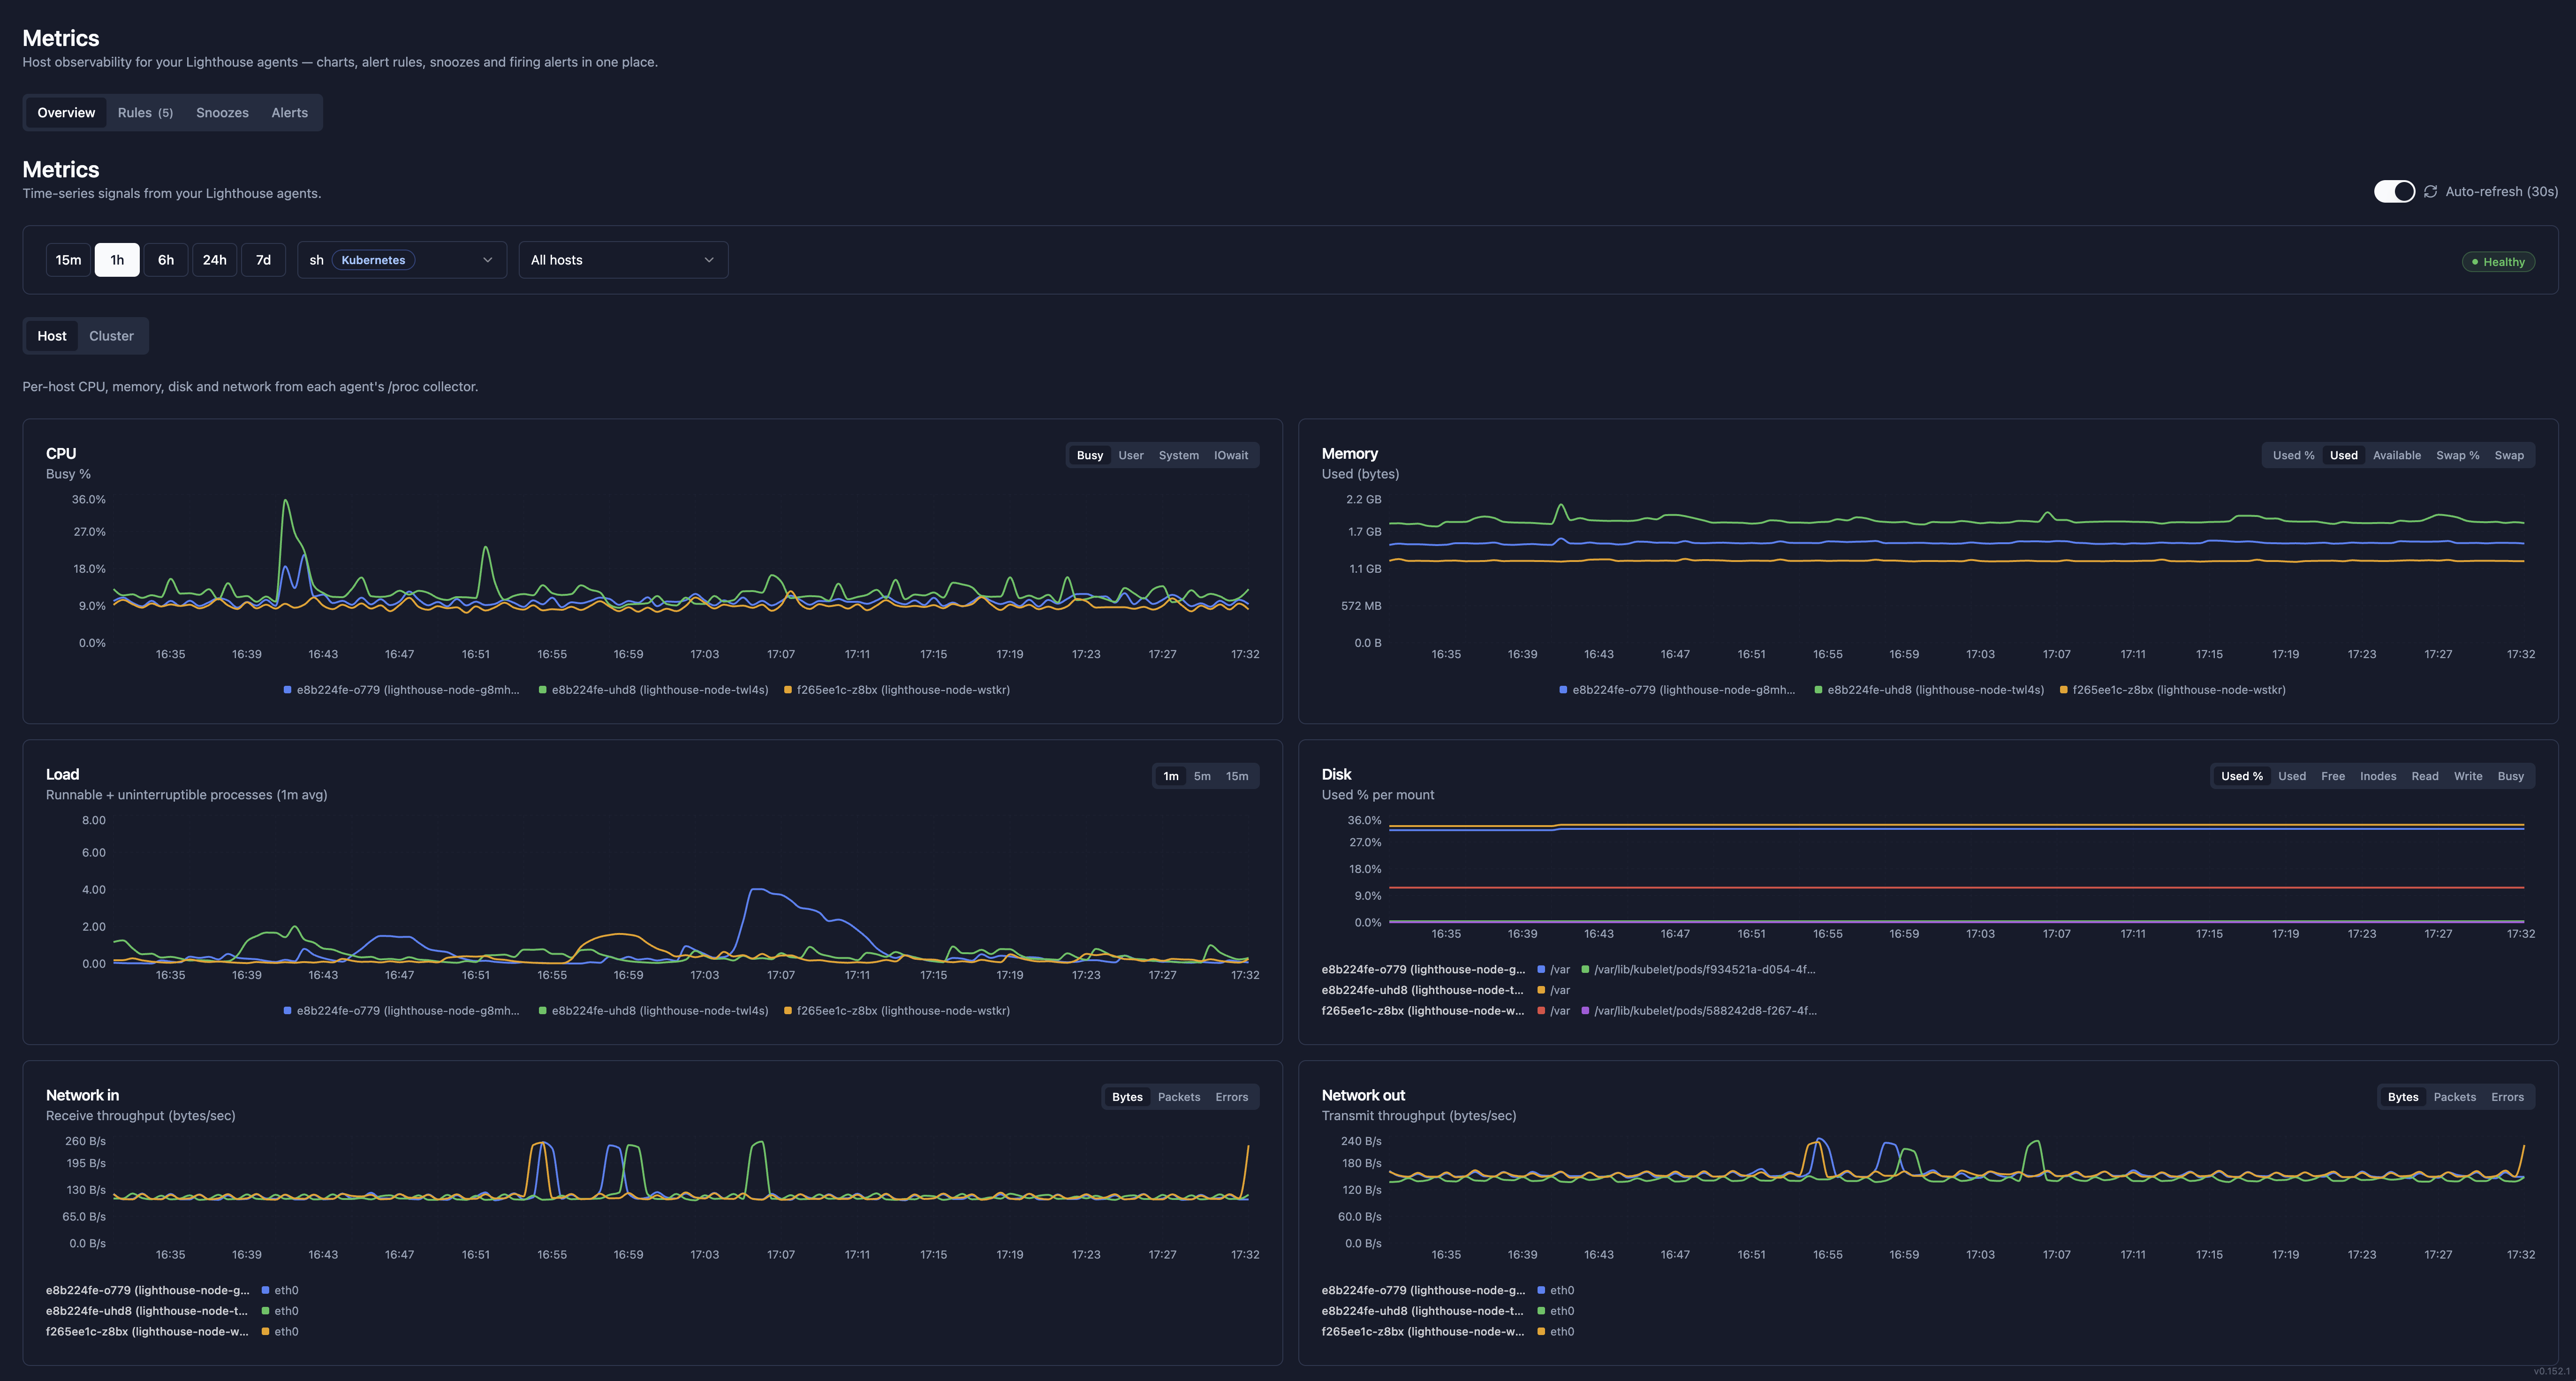
- Overview - real-time charts per agent across CPU, memory, load average, disk usage and network I/O. Pick a time range (15m, 1h, 6h, 24h, 7d), pick a Lighthouse and the charts update live with auto-refresh on.
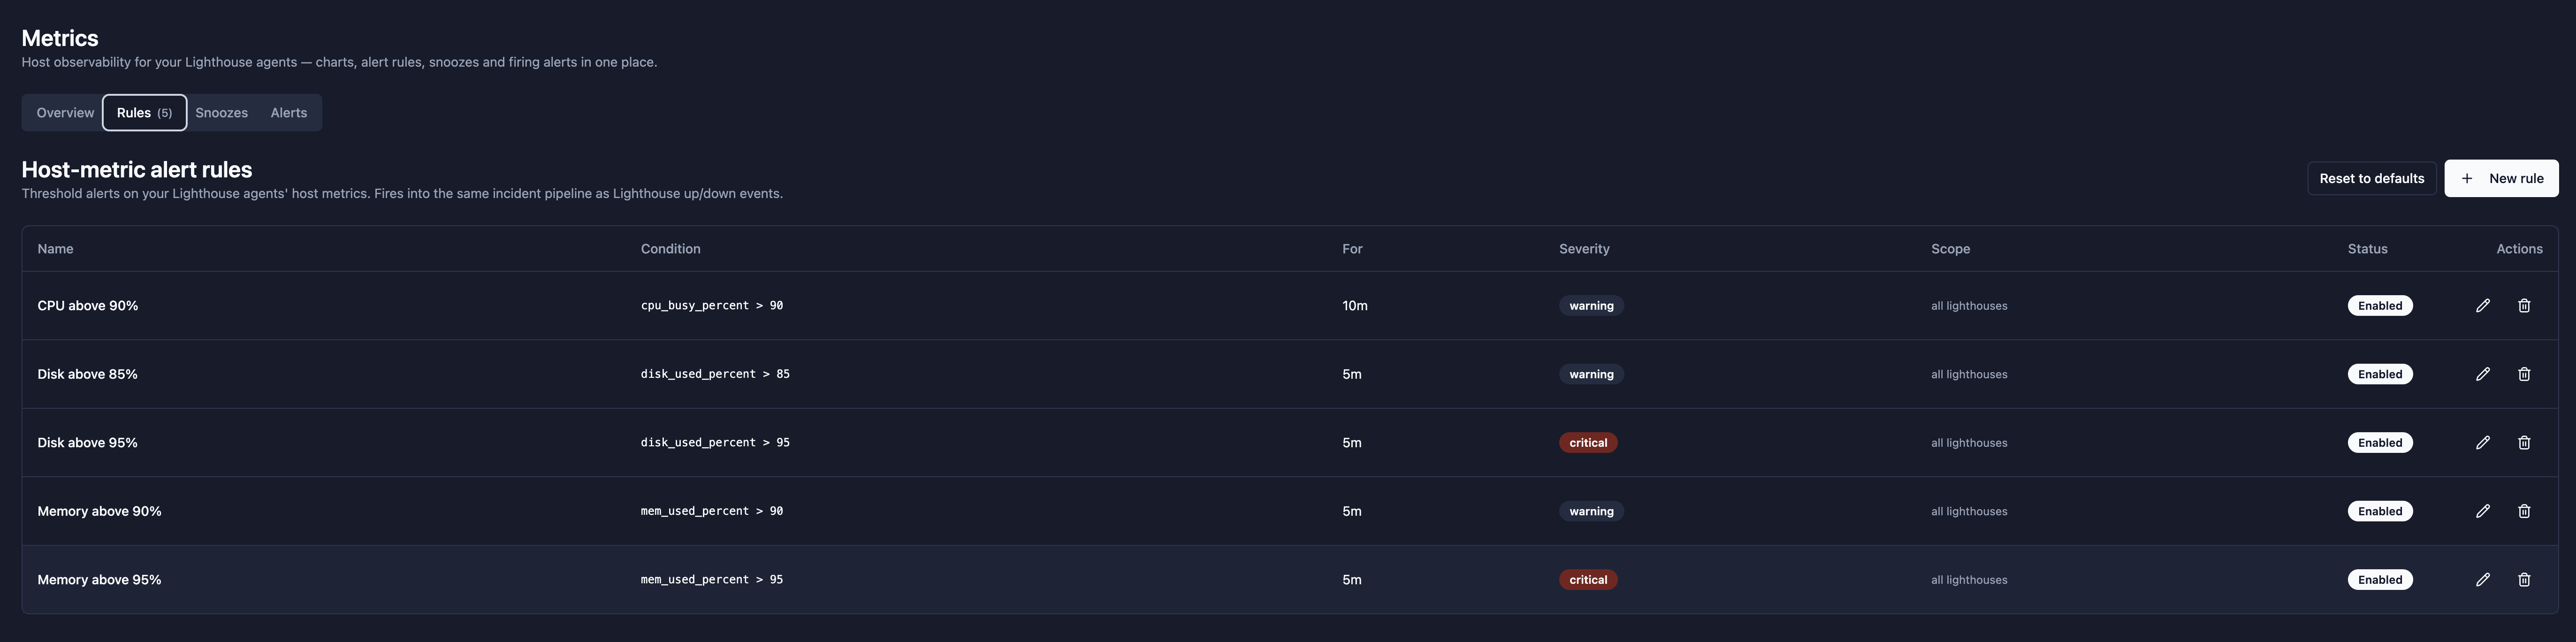
- Rules - threshold alert rules you build in the UI. Five sensible defaults are seeded into every team automatically so you have working coverage from day one.
- Snoozes - silence a noisy rule on one host for an hour, a day or indefinitely - without disabling the rule everywhere else.
- Alerts - the firing-alerts timeline. Every threshold trip opens an incident here, and resolution is automatic when the underlying metric clears.
Charts that match what you'd draw yourself
The Overview tab is what you'd expect: CPU busy %, memory used %, load average over 1m / 5m / 15m, disk usage per mount and network throughput per interface. Time-range presets jump between zoomed-in (last 15 minutes) and zoomed-out (last 7 days) without losing the agent or host selection.
When a single Lighthouse reports from multiple hosts, each host breaks out cleanly on the same chart - one line per host, the legend disambiguates and a host dropdown lets you drill into one.
Alert rules with a "would this have fired?" preview
The Rules tab is the difference between threshold monitoring that's useful and threshold monitoring you turn off after a week. Each rule is one row: a name, a condition (cpu_busy_percent > 90), a duration window, a severity and a scope.
Edit a rule and you get a live preview against the last hour of data from your actual agents:
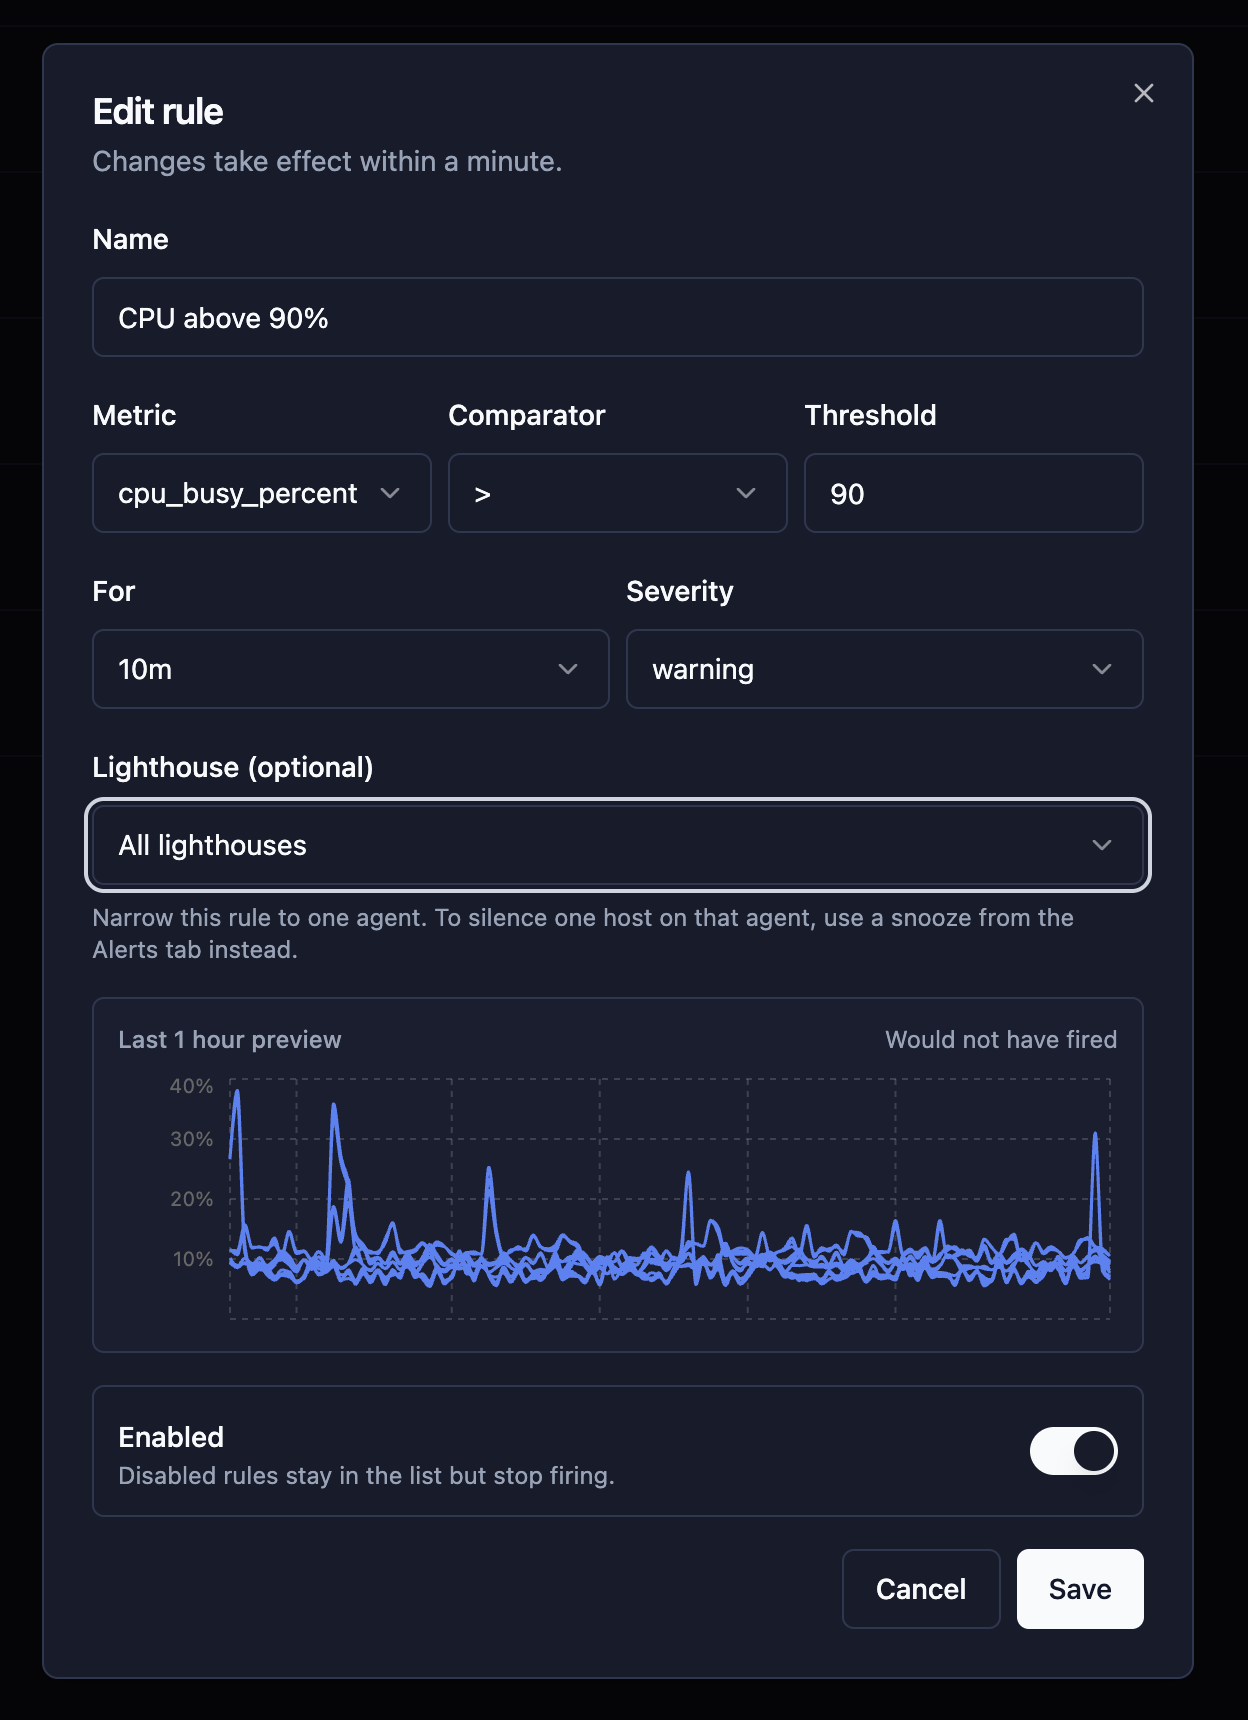
"Would not have fired" / "would have fired" right under the form means you stop tuning thresholds by guesswork. Drop the threshold, watch the preview turn red, raise it again until you're happy with the noise floor. Changes take effect within a minute.
Scope a rule to a single Lighthouse if you've got one host that runs hot by design (a CI runner, a build box) and want a separate threshold for it. Leave the scope as "All lighthouses" for everything else.
Snoozes for the box you'll fix on Monday
Sometimes you know a host is breaching a threshold and you don't want to be told about it for the next eight hours. Snoozes are the per-host, time-bounded version of "don't page me about this one."
Open a snooze on one host for a rule, pick a duration, add a reason for your future self. Other hosts under the same rule still fire normally. Already-open incidents close cleanly even while the snooze is in effect - resolved alerts always pass through so the timeline doesn't get out of sync.
When the snooze expires (or you unmute manually), normal alerting resumes on the next evaluation. There's no "and now the alert is stuck in the past" cleanup to do.
Alerts that open and close themselves
The Alerts tab is the timeline of every threshold that ever fired on this team's agents.

Two design choices worth calling out:
- No manual acknowledge. Threshold alerts open when the condition trips and close when the metric clears. There's no "click to acknowledge" step on purpose - if the box is back under 90% CPU, the alert closes itself, and you can read the timeline without wondering whether someone forgot to ack last Tuesday's blip.
- Alerts route through your existing channels. Whatever you've already wired up for uptime notifications - Slack, Telegram, email, webhook - is the same delivery path metric alerts use. No second integration to set up.
How to enable it
If you've already got a Lighthouse agent running, you're most of the way there. Update the agent to the latest version and host metrics start flowing on the next heartbeat.
The entry points to the new workspace are on the Lighthouses page itself:

Top-right has two new buttons: Host-metric rules drops you into the Rules tab, Host-metric alerts into the Alerts tab. From there everything is in the UI.
If you don't have a Lighthouse agent yet, the install steps are unchanged: pick your platform, paste the token, the rest happens automatically.
FAQ
Do I need to install anything new for Metrics?
No. Any Lighthouse agent on a recent version reports host metrics automatically. If you've installed an agent in the last few months, update to the current release and the charts populate on the next heartbeat.
Which metrics are collected?
CPU busy %, memory used % and bytes, load averages (1m / 5m / 15m), disk used % per mount and network throughput per interface. The full list of metric names is available in the rule editor.
Are alerts noisy?
The default ruleset is five rules - CPU above 90% (warning), disk above 85% (warning), disk above 95% (critical), memory above 90% (warning), memory above 95% (critical) - each with a 5-10 minute "for" window so a single spike doesn't page anyone. Edit, delete or reset to defaults from the Rules tab. The edit-rule preview shows whether your change would have fired against the last hour of real data, so you can tune thresholds against your own boxes rather than guess.
How long are metrics kept?
7 days for all teams. That's enough headroom to compare today against last week, page-through a weekend incident on Monday morning and tune alert rules against real baselines. Aggregations within that window stay at full resolution.
How do alerts get delivered?
Through the same notification channels you've already configured for uptime - Slack, Telegram, email, webhook. No second integration step, no second routing config. If your team gets uptime alerts in Telegram today, metric alerts arrive in the same channel tomorrow.
Can I monitor a private host this way?
Yes - that's the whole point. The Lighthouse agent talks outbound only, so a host inside a VPC, behind a firewall or on a homelab subnet is fully observable without opening inbound ports or running a VPN gateway. CPU on a Raspberry Pi in your basement is exactly the same shape on the dashboard as CPU on a production cloud VM.