Blog/How to Monitor Services Behind a Firewall Without Opening Inbound Ports
How to Monitor Services Behind a Firewall Without Opening Inbound Ports
Monitor services behind a firewall, VPN or VPC subnet without opening inbound ports — the outbound-only agent pattern, design choices and trade-offs.
May 17, 2026
Most uptime monitoring tools were designed for one thing: pinging public URLs from a public IP. That's fine for marketing sites and customer-facing APIs. It's also useless the moment you need to monitor something inside a private network — an internal admin panel, a database that only listens on the VPC subnet, a Kubernetes service exposed only to the cluster, the Pi-hole running in your homelab.
The default workaround is grim:
- Open an inbound port and an ALB or NAT rule, knowing full well you've just expanded your attack surface for a service that didn't need to be public.
- Stand up a VPN gateway and pay for the gateway, the routes, the logging, the on-call burden.
- Push metrics out of every host into a separate observability stack and infer "is the service up" from "is the metric pipeline reporting numbers" — which fails the moment the metric pipeline is what's broken.
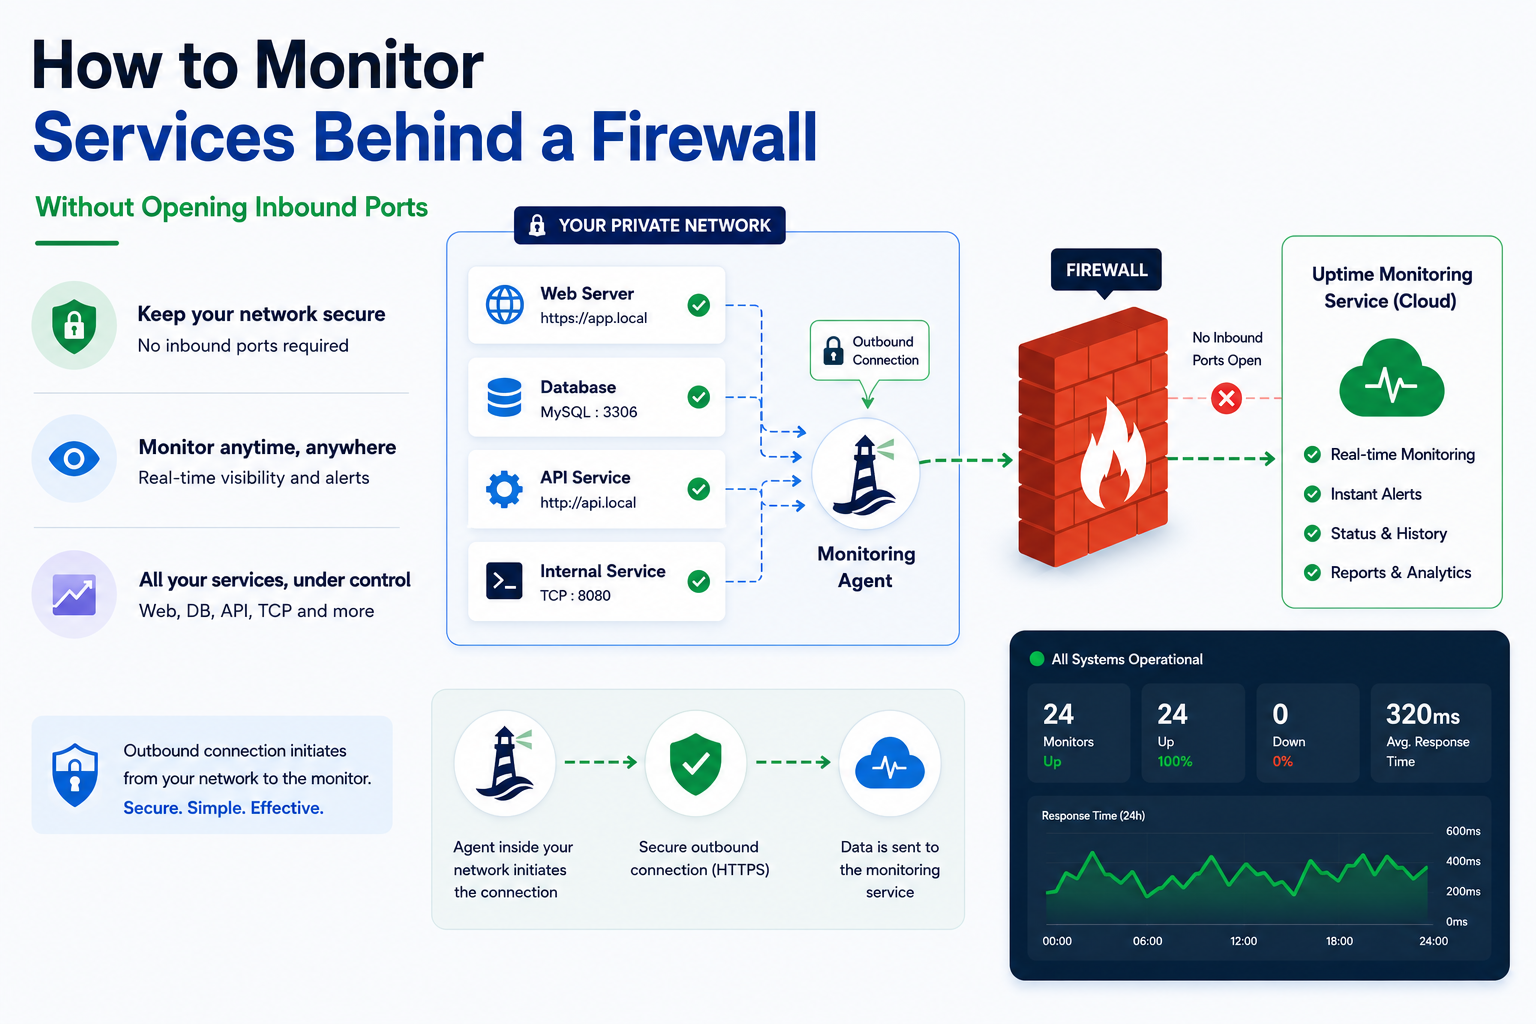
There's a fourth option, and it's both simpler and more secure than any of the above: run a small agent inside the network and have it report its own probe results outbound. That's how we built the Lighthouse agent for Status Harbor, and it's the pattern we'd recommend even if you're not using us.
This post is about the design choices behind that pattern. If you take nothing else away, take the architecture.
The shape of the problem
A typical "monitor a private service" scenario looks like this:
- The service runs on
10.0.4.17:8080. - It's reachable from inside the VPC and nowhere else.
- You want a clear signal — Slack, Telegram, email, whatever — when it stops responding.
- You'd prefer not to add an inbound listener, because every inbound listener is a thing somebody on the team has to think about for the rest of the service's life.
Public probes can't reach it. So whatever does the probing has to live somewhere that can reach it. The question is: who probes, and how does the result get back out?
Why the obvious answers are wrong
Open an inbound port. This is the path most teams take first because it's familiar. Add a security-group rule, expose the service through a load balancer, the public probe can hit it. The monitor works. You also now own a public attack surface for a service that — by your own definition five minutes ago — should not be public. Every CVE in your reverse proxy is now your problem. Every misconfigured Authorization header that ships in a future deploy is now exploitable. The worst version of this is when the monitor only looks at status codes — you've just paid the security cost of exposing the service in exchange for a check that doesn't even verify you're talking to the right thing.
VPN. Stand up a site-to-site VPN to the monitoring vendor. This works and is occasionally the right answer for enterprise contracts, but the operational tax is enormous: you now own routes, peering, key rotation, and a connectivity dependency between your private network and a third party. If the vendor's tunnel goes flappy, your "monitoring" page lights up red for reasons that have nothing to do with your service.
Push from inside. Each host pushes "I'm alive" pings to an external endpoint. This is closer to the right shape — outbound traffic only — but it inverts the meaning of "monitor." Heartbeats prove a process is running. They don't prove the service is responding correctly to actual traffic, which is the question you actually wanted answered.
The right shape is: probe like a real client, from inside the network, and ship only the result outward.
The agent pattern
Architecturally, what you want is a tiny binary that does three things:
- Receives a list of checks to run from a control plane.
- Runs those checks against services on its own network.
- Reports results back over an outbound HTTPS connection.
That's it. No inbound listener. No VPN. No platform integration. The same firewall rules that already let your hosts call out to GitHub or fetch container images are enough for the agent to talk to the control plane.
A few design choices matter more than they look:
Outbound HTTPS only. The agent never accepts connections. Nothing on the host needs to be exposed. From a network-admin's point of view, the agent is indistinguishable from a process that does curl calls — because that's effectively what it is.
Static binary, no dependencies. The agent should run as a single executable with no runtime, no package manager, no plugin system. Two reasons. First: it can run on the smallest VM you have, including a Raspberry Pi. Second: there is no auto-update, which means the binary you installed is the binary that runs until you replace it. That's a feature, not a limitation — surprise behavior changes from a monitoring agent are something you do not want.
Per-agent bearer token. Each agent gets its own credential, scoped to that one agent and revocable from the dashboard. Lose a host, rotate the token, the old one is dead. No shared API key for the whole fleet.
Probe like a real client. The agent does HTTP GETs, TCP handshakes, UDP sends — the same things the public probes from cloud regions do — just from inside the network. The data it reports is identical in shape to what a public probe returns: status code, latency, error string, timestamp. That symmetry pays off in the dashboard, where private and public checks live in the same incident timeline.
Buffer transitions on connection loss. If the control plane is briefly unreachable, the agent keeps running its local checks and queues state transitions in memory. When the connection comes back, it ships the buffer in order. Two important corollaries: don't drop transitions silently, and have the control plane mark the agent as offline if heartbeats stop, so a dead agent doesn't quietly look like "everything is healthy."
Don't transmit anything you didn't ask the operator to probe for. This is the security-and-trust line. The agent reports check metadata — was it up, what was the status code, what was the error string — but never response bodies, never request payloads, never host metrics, never anything the operator didn't explicitly configure as part of a check. If somebody asks "what does your monitoring agent send out of my network", the answer should be a short, exhaustive list.
What "monitor like a real client" buys you
The honest reason most cloud probes can't see your private services is the network path. The interesting reason is that even when they can — say, you've poked an inbound hole — they're probing from a network shape that doesn't match your real users. Internal users hit auth.internal.example over the corporate VPN with a different latency profile than a public probe over the open internet. Single-region public monitoring that says "your service is responding in 50 ms" can be true and irrelevant at the same time.
An agent inside the network gives you the latency your internal users actually experience. An agent in your Kubernetes cluster gives you the latency a sidecar would experience hitting the same service. That's a different signal than public uptime, and it's the one you want for "is this service usable for the people who depend on it."
Where this goes wrong
The agent pattern isn't free. A few realistic failure modes worth designing around up front:
The agent host itself dies. If the box the agent runs on goes down, every check that lives behind it goes silent. You need the control plane to differentiate "checks are failing" from "the agent stopped sending heartbeats." Treat the second case as its own incident class — and don't let it look like everything is fine.
Configuration drift. The agent should pull its check list from the control plane, not be configured locally. Otherwise you end up with state in two places and no good way to reconcile. Pull-based configuration also makes "delete this check" reliable — the next heartbeat picks up the change.
Token leakage. The bearer token is the only thing that authorizes an agent to report results. Treat it like any other secret: never commit it, never log it, rotate it if you suspect a compromised host. A per-agent scope keeps the blast radius small if a token does leak.
False sense of completeness. An agent monitors what the agent can see. If the network the agent lives on is itself partitioned from the service you care about, the agent's view doesn't help. Multi-region public probes plus one or more agents per private network gives you the most honest "is it up from where it matters" signal.
How to install it
The Lighthouse agent installs from one of four entry points, depending on where it's going to live. Pick the one that matches the rest of your stack — the agent behaves the same regardless of how it got there.
Linux (bare metal, VM, Raspberry Pi)
The shipped installer is a POSIX sh script — runs on minimal Alpine / busybox images. Detects OS and arch, downloads the latest signed release binary from GitHub, verifies the SHA256 checksum, writes lighthouse.yaml with mode 0600, and registers a systemd unit on Linux (or a launchd plist on macOS):
curl -fsSL https://lighthouse.statusharbor.io/install.sh \
  | LIGHTHOUSE_TOKEN=<token-from-console> sh
The binary lands in /usr/local/bin/lighthouse, the config in /etc/lighthouse/lighthouse.yaml, and the offline buffer in /var/lib/lighthouse. After the install, systemctl status lighthouse should show it running.
For Windows, download the signed lighthouse_windows_amd64.exe from GitHub Releases, verify the checksum, and register it as a service with NSSM or sc.exe create.
Docker
Multi-arch images (linux/amd64, linux/arm64) are published to GitHub Container Registry on every release. The image is Alpine-based, runs as a non-root user (uid 10001), and has no shell entrypoint.
Simplest form — env var only, no YAML required:
docker run -d --name lighthouse \
  -e LIGHTHOUSE_TOKEN=<token-from-console> \
  -v lighthouse-data:/var/lib/lighthouse \
  ghcr.io/statusharbor/lighthouse:latest
The lighthouse-data named volume persists the offline buffer across container restarts. Without it, results captured during a control-plane outage are lost when the container is recreated.
Mount a YAML config instead if you want to tune max_concurrent_checks, log_level or the data directory:
docker run -d --name lighthouse \
  -v /host/path/lighthouse.yaml:/etc/lighthouse/lighthouse.yaml:ro \
  -v lighthouse-data:/var/lib/lighthouse \
  ghcr.io/statusharbor/lighthouse:latest
Kubernetes
Two install paths. For anything beyond a quick try, use the Helm chart — it's published as an OCI artifact on every release (no helm repo add step):
helm install lighthouse oci://ghcr.io/statusharbor/charts/lighthouse \
  --namespace lighthouse --create-namespace \
  --set token=<token-from-console>
The chart ships a StatefulSet with a 5 Gi PersistentVolumeClaim for the offline buffer, a ServiceAccount, optional PodDisruptionBudget and NetworkPolicy, and Kubernetes-friendly /healthz/live and /healthz/ready endpoints.
For production, store the token in an out-of-band secret (External Secrets, Sealed Secrets, Vault) and reference it instead of inlining:
helm install lighthouse oci://ghcr.io/statusharbor/charts/lighthouse \
  --namespace lighthouse --create-namespace \
  --set existingSecret.name=lighthouse-token \
  --set existingSecret.key=token
Run exactly one agent per token. Two agents sharing the same token post duplicate observations and produce flapping incident state. The Helm chart pins replicaCount: 1 and refuses to install otherwise. If you need horizontal scale across multiple network segments, install the chart multiple times — one release per network, each with its own token from the Console.
A plain kubectl apply manifest is also available at deploy/k8s/lighthouse.yaml for clusters that don't run Helm.
Terraform
If you already manage infrastructure as code, the agent's registration and deployment can both live in Terraform. Two repos work together:
- The
statusharborprovider manages the Lighthouse resource — the registration with the Console and the bearer token. - The
terraform-lighthousemodules deploy the agent itself, with three flavours:modules/helm,modules/docker,modules/cloud-init.
The canonical wiring — register a Lighthouse and deploy it to Kubernetes in the same plan:
terraform {
  required_providers {
    statusharbor = {
      source = "statusharbor/statusharbor"
    }
  }
}

provider "statusharbor" {
  # Or set STATUSHARBOR_API_TOKEN
  api_token = var.statusharbor_api_token
}

resource "statusharbor_lighthouse" "prod_vpc" {
  name                      = "prod-vpc"
  notify_on_lifecycle       = true
  flap_protection_threshold = 2
}

module "lighthouse" {
  source = "github.com/statusharbor/terraform-lighthouse//modules/helm?ref=v0.1.0"

  release_name = "lighthouse"
  namespace    = "status-harbor"
  token        = statusharbor_lighthouse.prod_vpc.token
}
Two things worth knowing:
- The
tokenattribute is sensitive and persists in your Terraform state. Use a remote encrypted backend (Terraform Cloud, S3 + KMS, GCS + KMS) to avoid leaking it. terraform importcan adopt an existing Lighthouse by UUID but can't recover the agent token — imported state has an emptytoken. If you need to rotate, delete and recreate the resource.
For Docker-host deployments swap modules/helm for modules/docker; for cloud VMs (AWS / GCP / Azure) use modules/cloud-init to emit a user_data script that runs the same install.sh flow described above.
Verifying release artifacts
Every binary on the GitHub Releases page is signed with Sigstore cosign and accompanied by a Software Bill of Materials. To verify a downloaded binary:
cosign verify-blob \
  --certificate lighthouse_linux_amd64.cert \
  --signature  lighthouse_linux_amd64.sig \
  --certificate-identity-regexp 'https://github.com/statusharbor/lighthouse' \
  --certificate-oidc-issuer 'https://token.actions.githubusercontent.com' \
  lighthouse_linux_amd64
How we built this
The Status Harbor Lighthouse agent is exactly this pattern: a single static Go binary, outbound HTTPS only, per-agent token, pull-based config, runs anywhere a Linux process can run. We use the same dashboard for public checks (from our 9 cloud regions) and private checks (from however many Lighthouses you've installed) — same incident timeline, same alert channels, same uptime math. The interesting part is what we deliberately chose not to put in: no auto-update, no plugin system, no telemetry beyond check metadata, no configuration that lives on the host.
The agent itself is open source under Apache 2.0 — source at github.com/statusharbor/lighthouse. If you want to use the architecture without us, the design is straightforward enough to copy — we built it because the pattern was missing from the off-the-shelf tools, not because the pattern is hard.
The takeaway is the architecture, not the product: outbound-only agents are the right answer for monitoring services behind firewalls, and any tool that asks you to open inbound ports for monitoring is asking you to pay a security tax for a problem that doesn't require one.