Host & cluster metrics from
the agent you already installed
Every Lighthouse agent now streams CPU, memory, disk and network from the host it runs on. Add the DaemonSet flavour to a Kubernetes cluster and every node reports too. Set warning and critical thresholds, snooze noisy hosts and watch per-host history in the same workspace as your uptime checks.
Uptime checks alone do not tell you when a host is about to fall over
External checks tell you whether your endpoint responds. They will not tell you that the host serving it is at 96% disk, that one node in your cluster has been steadily leaking memory for two days, or that an IOwait spike is about to turn into a five-minute timeout. The first warning is usually the page itself, and by then the incident is already open.
The usual answer (Prometheus + Grafana + Alertmanager + a notification router + a UI) doubles the surface area your team has to operate. Now you also have a metrics stack to upgrade, a rules engine to keep in sync with your alert channels, and a separate dashboard to remember.
Status Harbor folds host and cluster metrics into the agent you already trust for uptime. Same install, same alert pipeline, same workspace. The Metrics tab is where charts, threshold rules, snoozes and firing alerts all live; nothing else moves.
How it works
1. The agent reports host vitals on every interval
Wherever the Lighthouse agent runs (a Linux box, a VM, a container), it samples /proc and ships CPU, memory, load, disk and network counters back to Status Harbor on the same outbound HTTPS connection it already uses for monitor results. No new ports, no new daemons.
2. On Kubernetes, the DaemonSet covers every node
Enable the DaemonSet flavour in the Helm chart and one pod per node reports the node itself (not the container). The central pod also calls the kubelet to surface per-node and per-PVC capacity, plus cluster-wide CPU and memory aggregates. Per-node metrics carry the node name so "which one is unhealthy?" is one chart away.
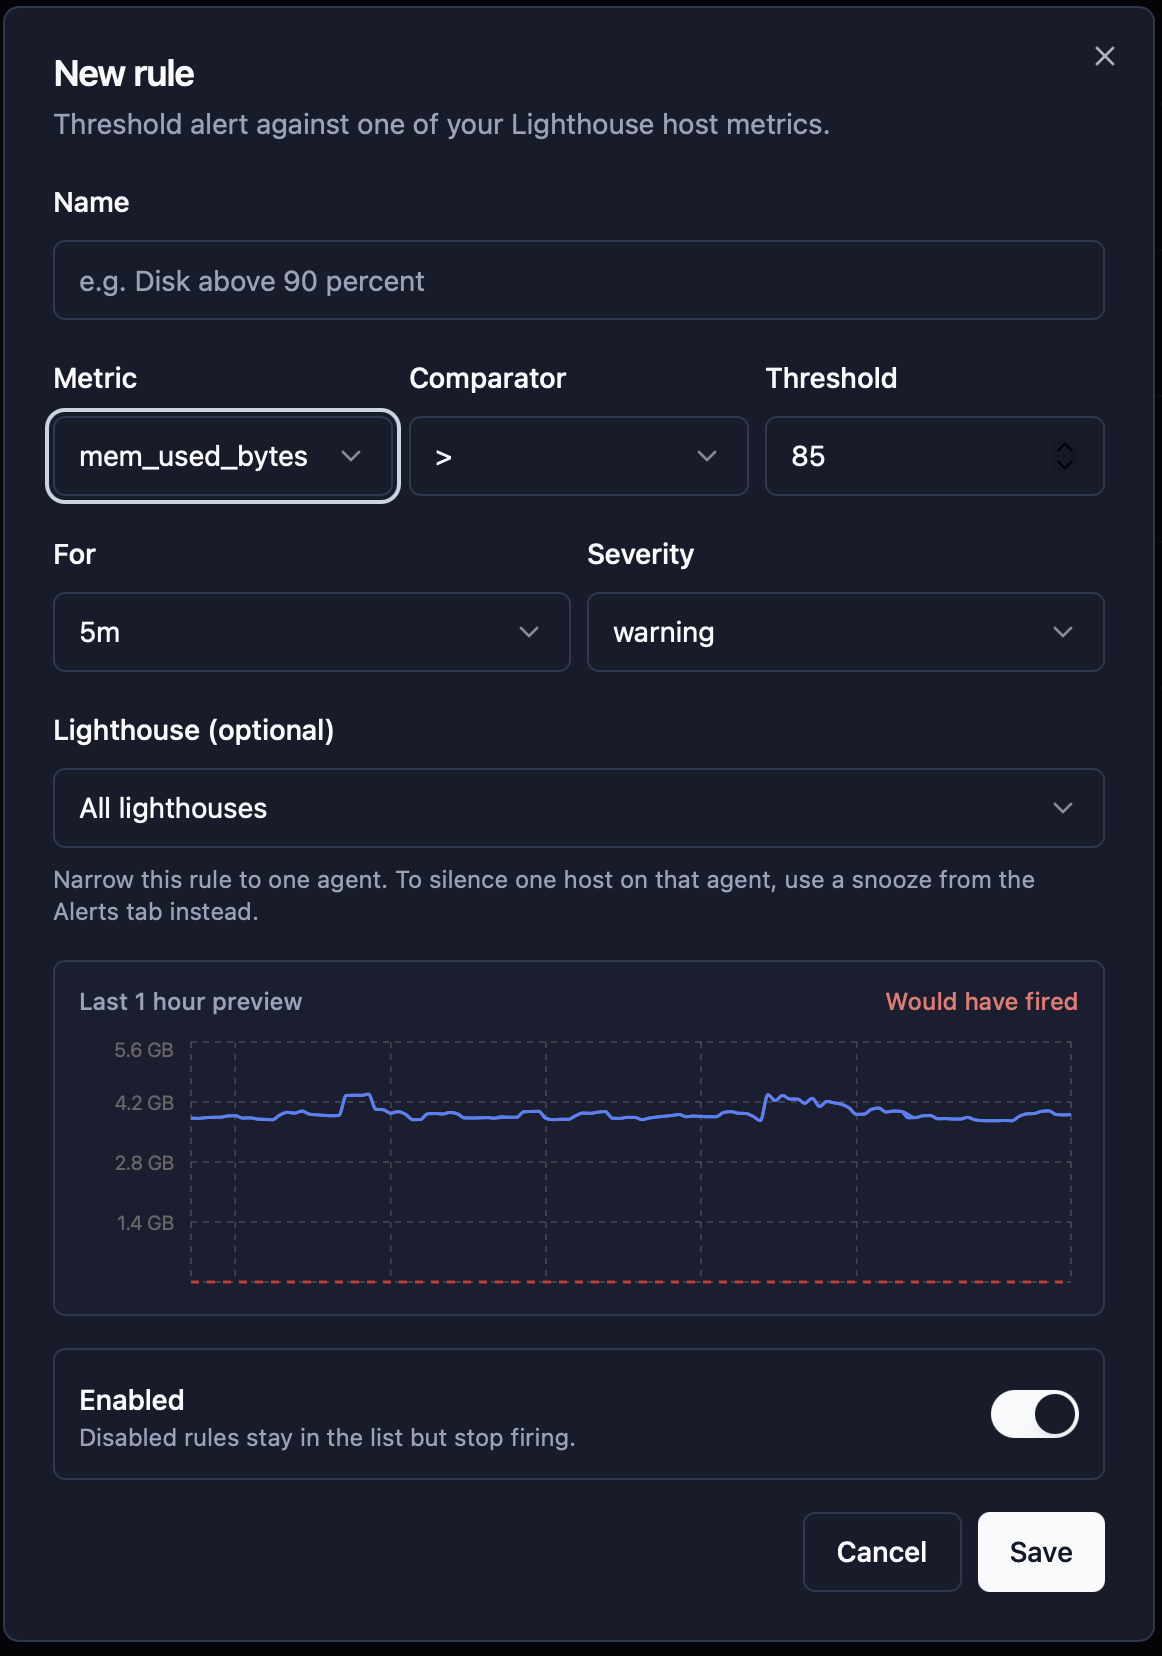
3. Threshold rules with a last-hour preview
Pick a metric, a comparator, a value and how long the breach has to hold for. Choose warning or critical severity. The rule editor previews the last hour against your threshold and tells you whether it would have fired, so you tune numbers against real data rather than guessing.
4. Alerts land where your uptime alerts already do
Slack, Telegram, email or your webhook, with the same payload shape as your monitor alerts. A metric alert opens when the threshold trips, closes when the metric clears, and shows up in the Alerts tab with the host that triggered it. There is no manual acknowledge step, because the metric clearing is the acknowledge.
One workspace, every signal
The Overview tab puts CPU, memory, load, disk and network on the same screen. Toggle between hosts and clusters, narrow to a single Lighthouse, or compare across the fleet. Time ranges from the last 15 minutes to the last 7 days, with 30-second auto-refresh.
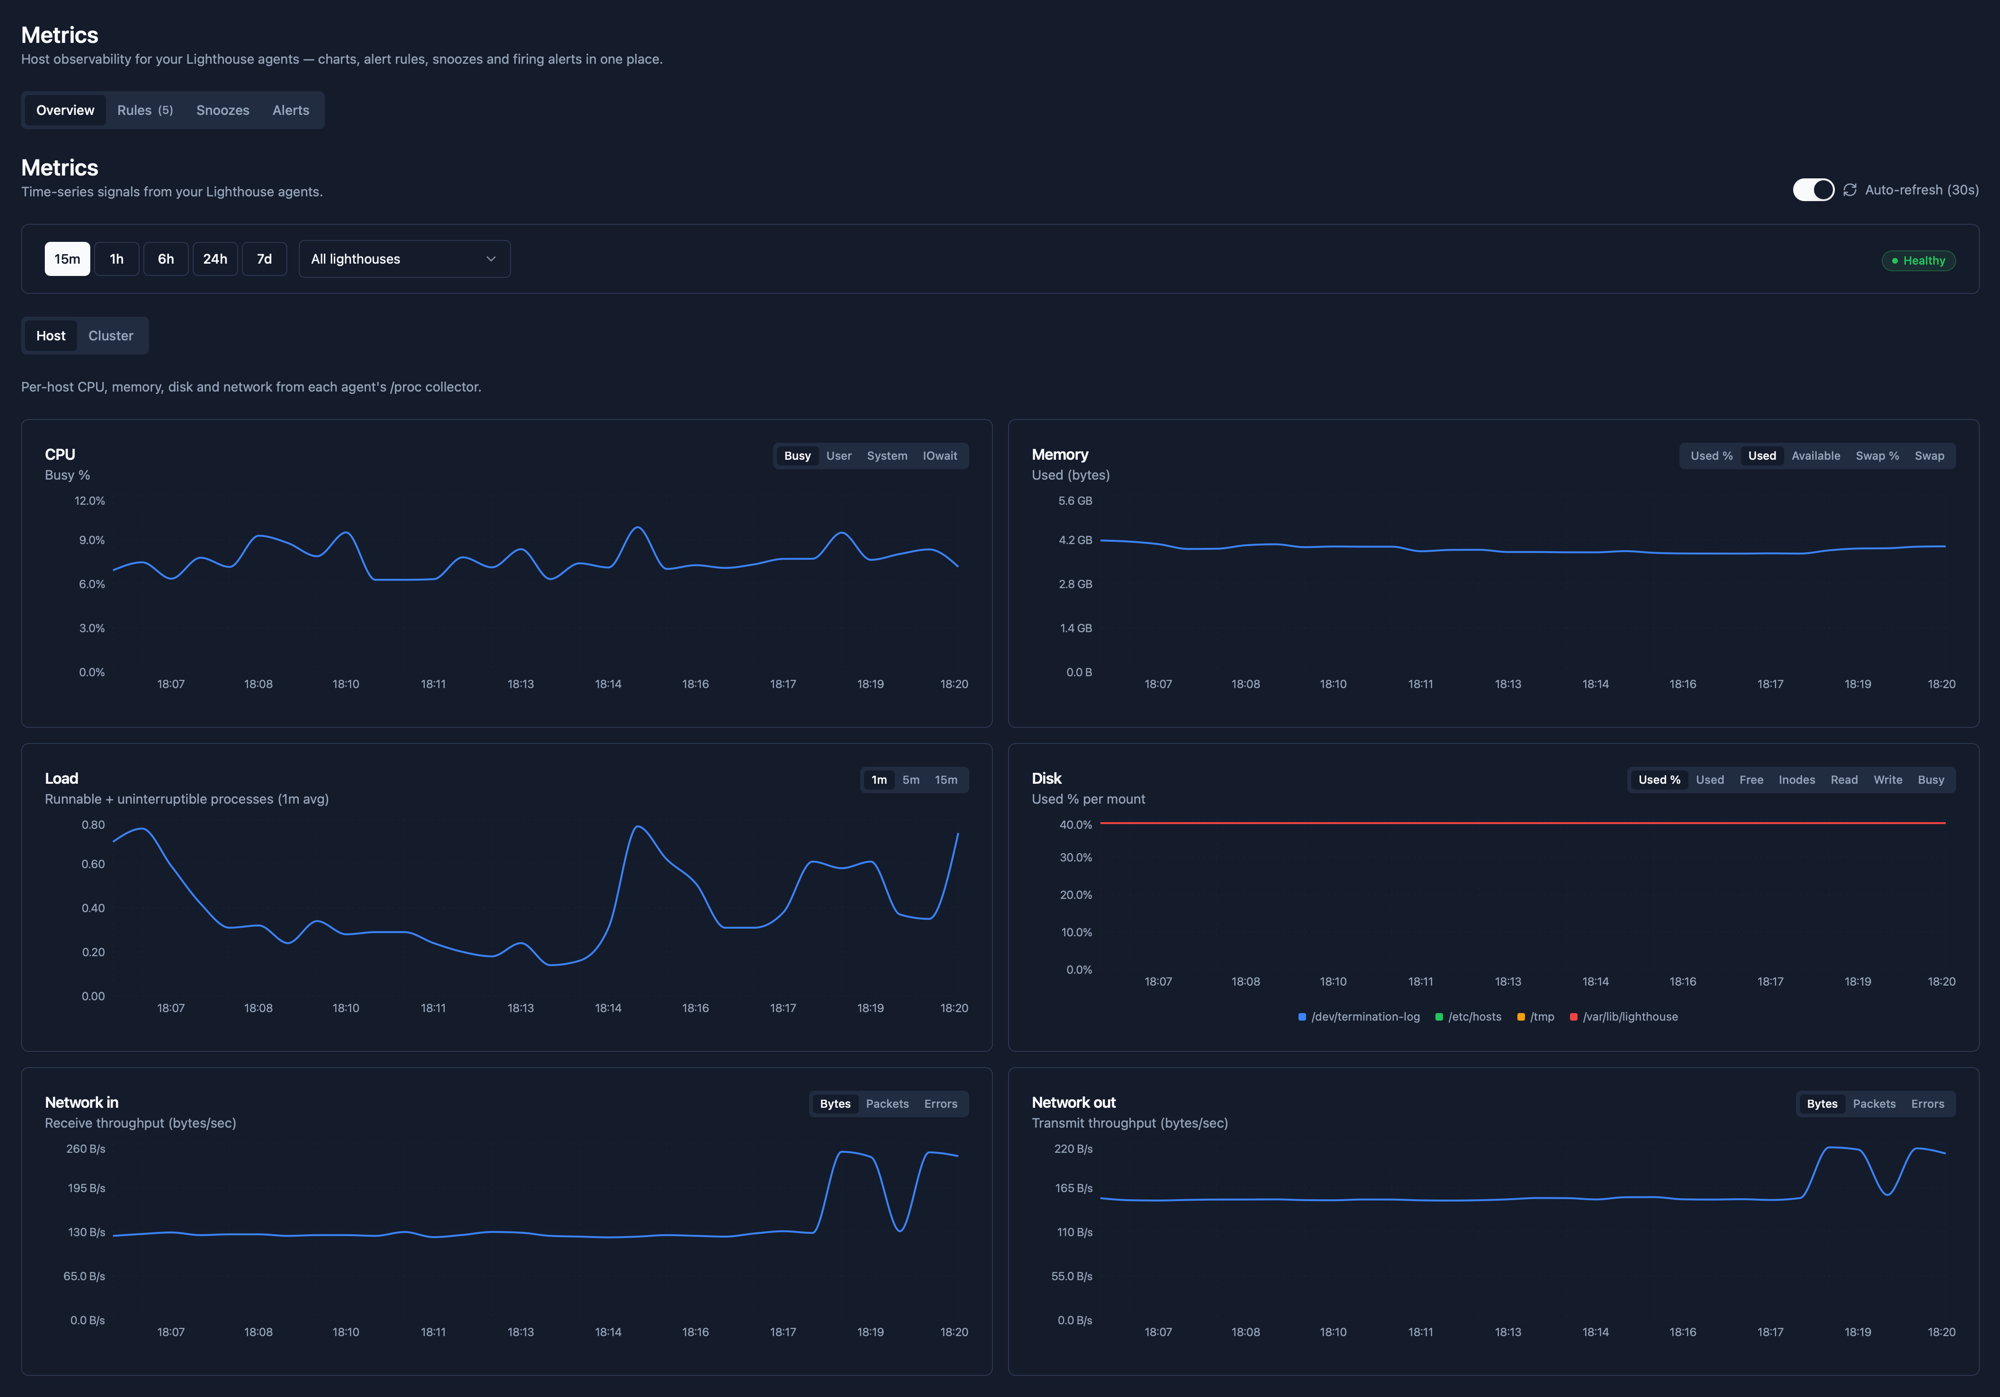
What you can chart and alert on
- CPU: busy, user, system and IOwait percentages.
- Memory: used bytes, used percent, available bytes, swap usage and swap percent.
- Load average: 1-minute, 5-minute and 15-minute runnable + uninterruptible counts.
- Disk: used percent per mount, used / free bytes, inode pressure, read and write throughput, IO busy.
- Network: per-interface receive and transmit, in bytes, packets and errors.
- Per-node Kubernetes: every metric above, but stamped with the node name so a noisy node is one filter away.
- Per-PVC Kubernetes: used percent per persistent volume claim, so cert-manager and Prometheus stores never run out of disk silently.
- Cluster aggregates: whole-cluster CPU and memory headroom on one chart.
Defaults that get you alerting on day one
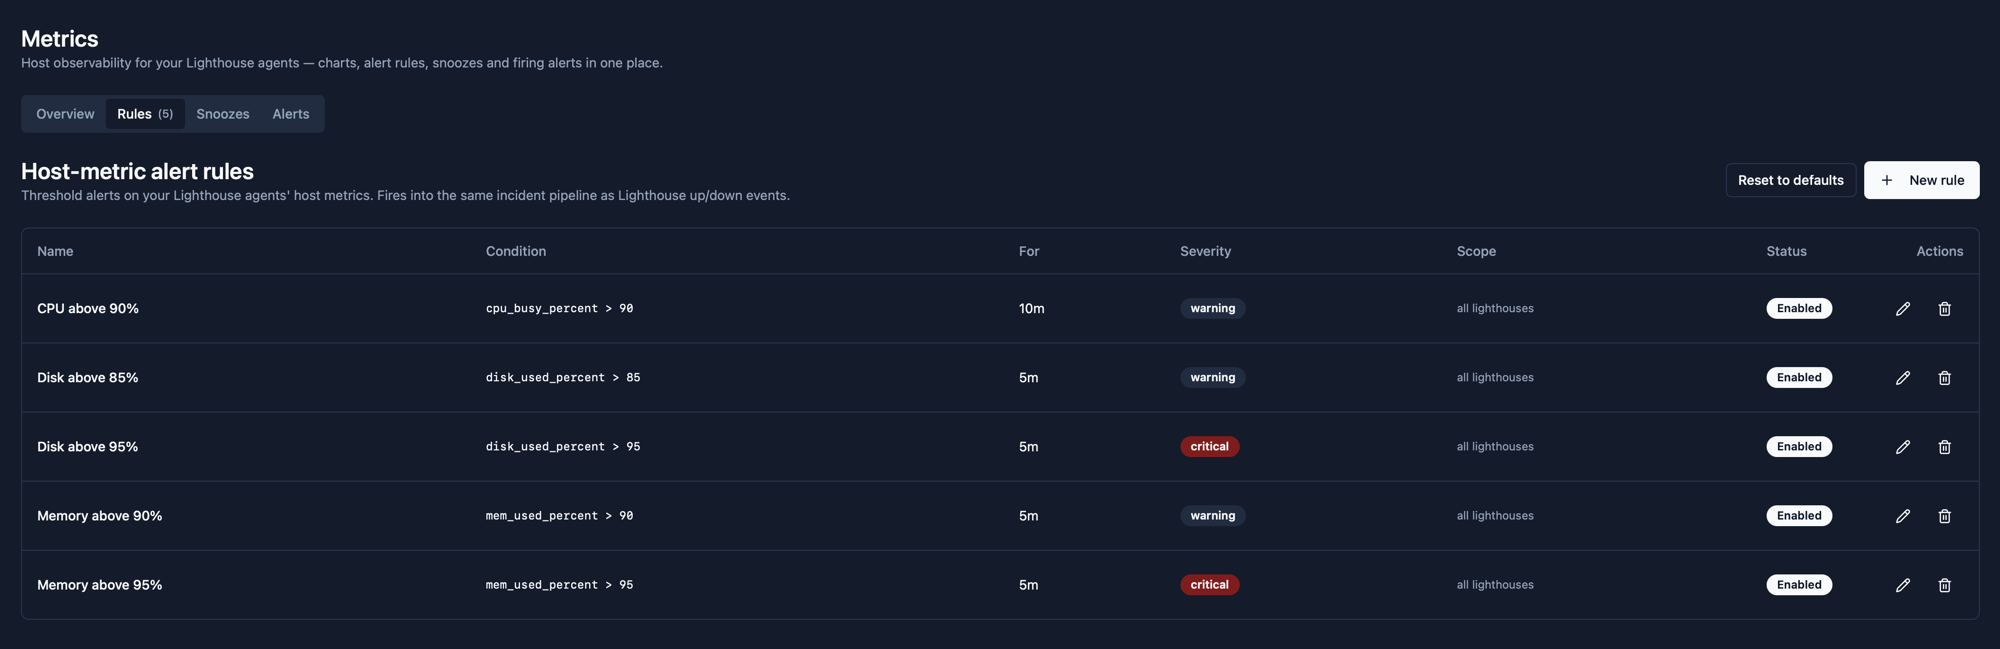
Every new team gets five host-metric alert rules seeded automatically. Tune the thresholds, add new ones, or reset to defaults at any time. Rules fire into the same incident pipeline as your Lighthouse up / down events.
| Name | Condition | For | Severity |
|---|---|---|---|
| CPU above 90% | cpu_busy_percent > 90 | 10m | warning |
| Disk above 85% | disk_used_percent > 85 | 5m | warning |
| Disk above 95% | disk_used_percent > 95 | 5m | critical |
| Memory above 90% | mem_used_percent > 90 | 5m | warning |
| Memory above 95% | mem_used_percent > 95 | 5m | critical |
Build a rule against last hour’s data
The rule editor previews your threshold against the last hour of real metrics from the agent it will target. Drag the threshold up and down to see whether your number is noisy. The “Would have fired” indicator turns red the moment the breach holds for the duration you picked.
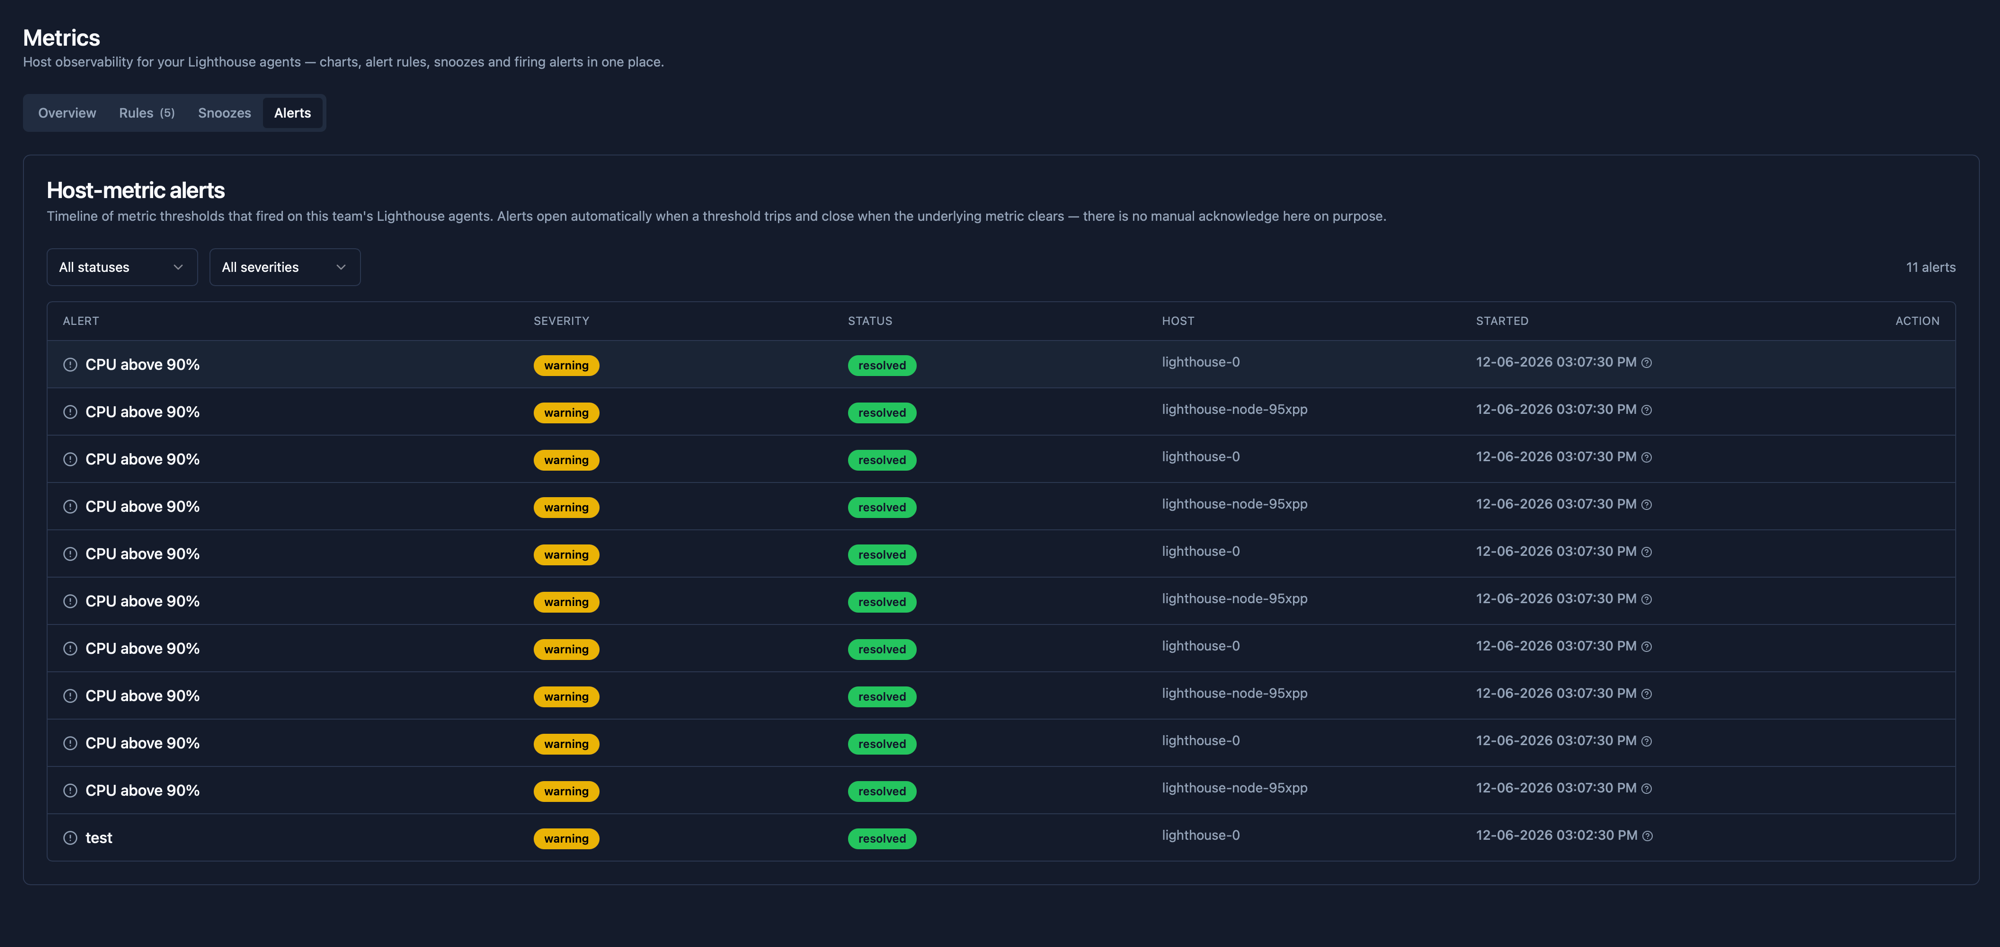
Alerts that close themselves
The Alerts tab is a timeline of every threshold that has fired on your fleet, with the rule that fired it, the severity, the host and the start time. Alerts open automatically when the threshold trips and close automatically when the underlying metric clears. There is no manual acknowledge here on purpose - the metric clearing is the acknowledge.
What makes it different
No second stack to operate. The agent you already deployed for uptime is the same agent that streams metrics. One install, one token, one set of upgrades.
Thresholds with hindsight. The new-rule dialog previews the last hour so you can see whether the number you picked would have been noisy, before it ever pages anyone.
Snoozes are first class. Silence a flapping host for an hour, a day or until you say otherwise, without disabling the rule for everyone else. Resolved alerts always pass through, so existing incidents close cleanly even while a snooze is active.
Single alert pipeline. Threshold alerts and uptime alerts use the same delivery channels, the same payload shape and the same incident grouping logic. One Slack channel, not two.
Pricing
Metrics ride on the same Lighthouse agents your monitors already use, so they are included on every paid plan. The Free plan includes 1 Lighthouse agent; the Pro plan includes 3, which covers a production cluster plus staging and dev. See full pricing.
Frequently asked questions
What does the agent actually collect?
CPU (busy, user, system, iowait), memory (used bytes and percent, available, swap), load average (1m, 5m, 15m), per-mount disk usage (percent, used, free, inodes, read and write throughput, IO busy) and per-interface network counters (bytes, packets, errors). On Kubernetes, the same shape is also reported per node, plus per-PVC disk usage and cluster-level aggregates.
Does this replace Prometheus or Grafana?
For host and cluster vitals (CPU / memory / disk / network), yes. The point is to remove a moving part rather than add one. You get charts, threshold alerts, snoozes and history without standing up Prometheus, Alertmanager, a notification router and a UI on top. Teams that already run Prometheus for application metrics keep using it; Status Harbor covers the operational tier under it.
How do threshold alerts work?
Pick a metric, a comparator and a value, then a duration the breach has to hold for (so a one-minute spike does not page you). Choose warning or critical severity. Alerts fire into the same incident pipeline as your Lighthouse up / down events, so they reach Slack, Telegram, email or your webhook with no extra wiring. Alerts close automatically when the metric clears, so there is no manual acknowledge to forget.
Can I narrow a rule to one Lighthouse?
Yes. A rule defaults to all of your Lighthouse agents but you can pin it to one when only that agent should fire it (for example, a database host with a different disk profile). For silencing a single noisy host within an agent, use a snooze from the Alerts tab instead of cloning the rule.
How do snoozes work?
Snoozes silence a firing alert without disabling the rule for the rest of your fleet. They can be temporary (an hour, a day) or indefinite. Resolved alerts always pass through, so pre-existing incidents close cleanly even while a snooze is active.
How long is metric data kept?
Metric chart history is kept for 7 days for every team. Firing alerts and their resolution timestamps are kept independently in the alerts timeline, so the history of what fired and when is retained beyond the chart window.
Turn the agent you already have into a metrics source
Free for the first Lighthouse, no credit card.
Start monitoring freeRelated
- Private network monitoring: the broader pattern the same agent powers for in-network uptime checks.
- Kubernetes monitoring: deploy the DaemonSet flavour to cover every node in your cluster.
- On-prem monitoring: the same agent on bare-metal Linux hosts that never touch the public internet.